Findings from the 2015 Ponemon Institute Cost of Cybercrime Study: The Threats vs. Defenses Gap
| Contact Us | |
| Free Demo | |
| Chat | |
Last month the Ponemon Institute released its annual Cost of Cybercrime report covering damages from cybercrimes in the past year. Here are some of the key findings.
Covering cyberattacks on over 250 enterprises spanning the United States, United Kingdom, Germany, Australia, Japan, Russia, and Brazil, this was Ponemon’s most global cybercrime study in scope in its six years of publishing the report. At the highest level the survey found that, on average, cyberattacks cost companies $7.7 million in 2015, representing a 1.9% increase over 2014. U.S.-based companies in particular were responsible for much of this increase, with annual cyberattack costs per company at $15.4M – up 19% over 2014. Those costs include everything from the attack detection phase through incident response and post-incident costs such as loss of revenue.
Ponemon attributes the increasing costs of cybercrime to several factors, including organizational size, industry, timeline for resolution (the timespan from when the attack starts to containment), and attack type. Logically, the impact that these factors have on total incident cost make sense. The larger an organization is in terms of headcount, the greater the surface area for compromise, and attacks that are larger in scale are typically more costly overall. Different industries will have widely different systems in place as well as different levels of value in the data they handle, and these factors will drive cost models unique to each vertical – financial services and utilities & energy had the highest cybercrime costs this year. Resolution timeline is pretty self-explanatory as well: the longer an incident takes to detect and contain, the more opportunity there is for costly damages.
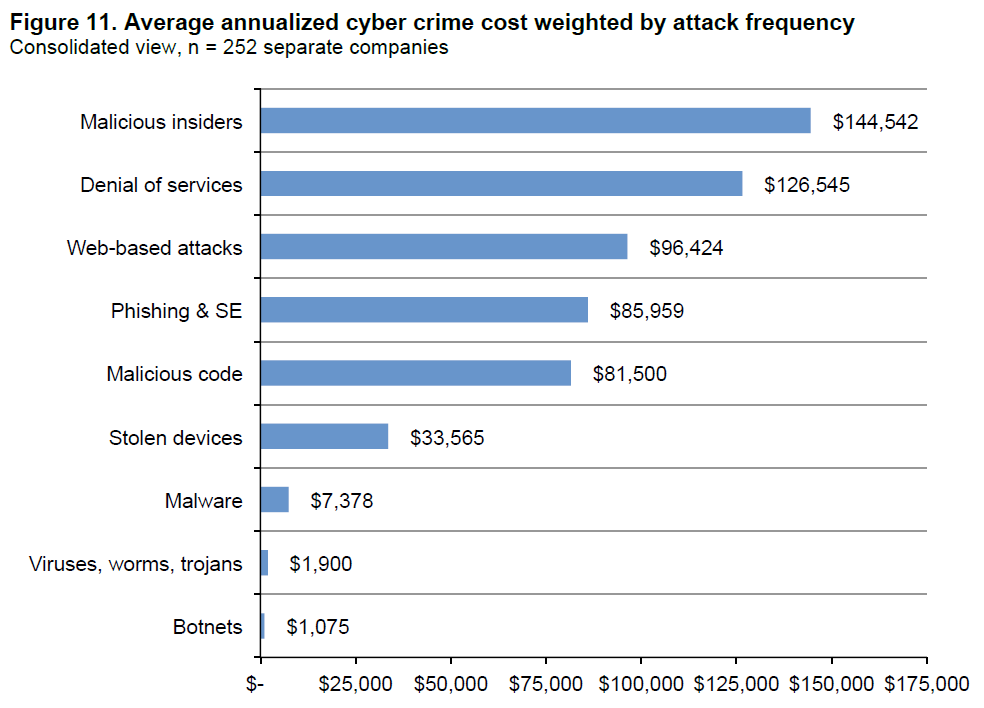
Then there’s attack type, the factor with perhaps the most significant impact on incident costs and highest variance between types. This year’s report found that attacks by malicious insiders were the most expensive, costing companies an average of $144,542 annually, followed by denial-of-service ($126,545) and web-based attacks ($96,424). While malware attacks were the most commonly experienced, their cost proved significantly lower ($7,378 annually).

Figure 11: Average annualized cyber crime cost weighted by attack frequency. Image via Ponemon Institute.
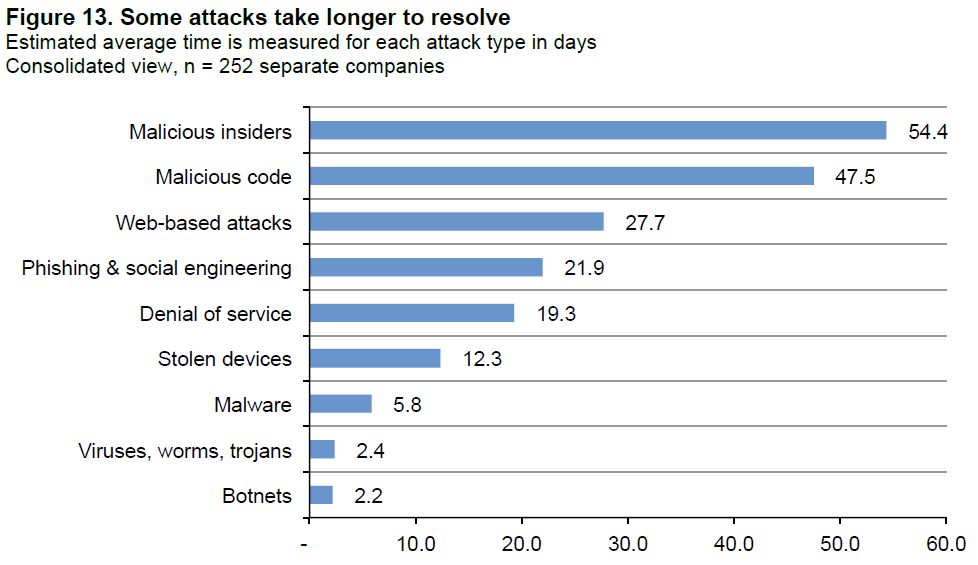
Regarding insider attacks, these findings are not exactly new. Insider threats have long been a costly challenge for enterprises; they are among the hardest types of attacks to detect and defend against. Because insiders already have legitimate access to data and systems, determining what insider activity may be a threat and being able to stop that activity requires robust capabilities for both monitoring and control. In addition to being the most costly, the report found that attacks by malicious insiders also take the longest to resolve, with an average resolution timeline of 54.4 days. As noted earlier in the report, longer resolution timelines can drive up costs significantly; this figure also speaks to the difficulty in detecting insider attacks.

Figure 13: Average resolution time by attack type. Image via Ponemon Institute.
The report also covers the most costly activities associated with cyber attacks. Externally, business disruption and information loss were the most costly. Internally, detection is the most costly phase of a cyber attack, followed by recovery.
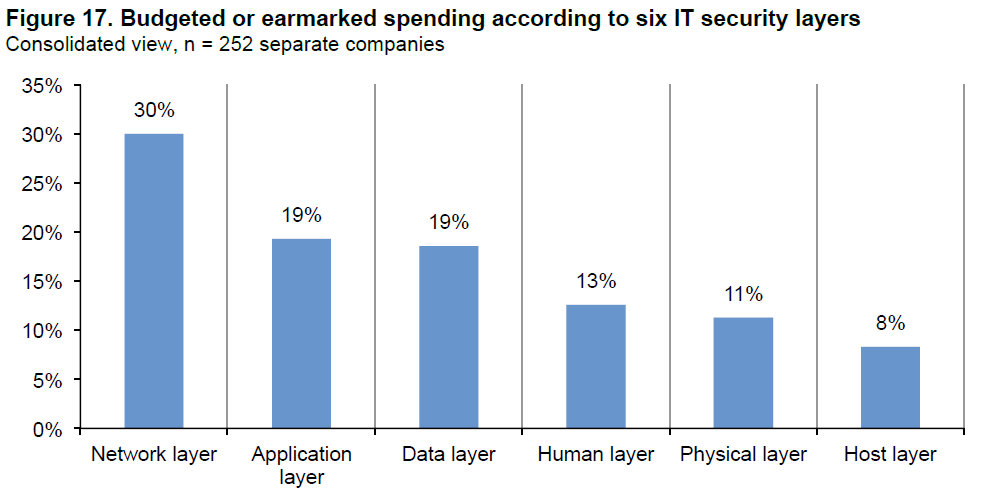
Beyond providing figures for costs by industry and attack type, Ponemon presents some interesting analysis on how companies are allocating security budgets to various defense layers. Based on the 252 companies surveyed, security spending was allocated as follows:

Figure 17: Budgeted security spending by layer. Image via Ponemon Institute.
Based on some of the findings earlier in the report, there seems to be some disconnect between the most damaging threats and how companies are spending their security dollars. Looking across the top four highest-budgeted layers, you would almost expect the figures to be inverted. Network security receives the highest spend, yet the network is only the first line of defense, and many of the attacks that target networks – such as malware or botnets – are among the least costly, despite being highly prevalent. Conversely, the human and data layers receive significantly less funding, yet these make up an organization’s last line of defense against attacks and can prove the most costly when compromised. For example, compromises at the data or human layer almost certainly lead to data loss and business disruption, Ponemon’s highest-costing activities in incident resolution. What’s more, investment in network security is far less effective in mitigating insider threats or social engineering (two of the top three most expensive attack types) than investment in data security or employee security awareness.
These numbers tell a story that has long been an issue in security: the threat landscape has changed and the traditional network “perimeter” has dissolved, yet many security strategies and budget allocation have remained unchanged. Earlier in the year this blog published an infographic that analyzed security spending and data breaches over the past five years, and the findings were largely the same: network security receives huge spend while other layers – particularly data security – receive significantly less.
There’s much more to Ponemon’s report, and these were just the findings that stuck out to me in particular. You can read the full report here.
Recommended Resources

All the essential information you need about DLP in one eBook.

Expert views on the challenges of today & tomorrow.

The details on our platform architecture, how it works, and your deployment options.